
As the Customer Lead and UX/UI Designer for Ad Optima, my Research Practicum module at UCD, I spearheaded the development of a data analytics web application that revolutionized Out Of Home (OOH) advertising strategies for small businesses in Manhattan. Taking ownership of the product vision, user experience design, and front-end development, I transformed complex location and demographic data into an intuitive platform that helped businesses make data-driven advertising decisions. My comprehensive approach to product development—from initial user research and wireframing to high-fidelity prototyping and front-end implementation—resulted in a robust application that achieved an 85% user satisfaction rating while successfully predicting the busiest advertising locations with 98% accuracy, delivering measurable ROI for NYC's small business community. As a result, the project and my contributions got me an A+ from UCD School of Computer Science's professors.
Surveyed users were highly satisfied and could easily navigate through Ad Optima.
Accuracy achieved by the machine learning model for busyness prediction.
Increase in advertising effectiveness compared to their previous approaches.
Manhattan is home to over 456,000 businesses, 98% of which are small businesses with fewer than 100 employees. These small businesses face significant challenges in the competitive New York market, including high operational costs and the need to maximize their marketing budgets. Meanwhile, 11% of NYC storefronts stood vacant, creating missed opportunities for targeted advertising.
Our research revealed that OOH advertising remained highly effective, with 70% of people noticing billboards during commutes and one-third of customers visiting businesses within a week of seeing advertisements. However, small businesses struggled to identify optimal advertising locations that would reach their target demographics at the right time. Traditional approaches relied on anecdotal evidence or expensive market research that often yielded suboptimal results.
The disconnect was clear: Businesses needed a data-driven way to identify high-traffic areas aligned with their target demographics, while property owners with vacant spaces needed a way to monetize through temporary advertising. Without access to sophisticated data analysis tools, small businesses were missing valuable opportunities to maximize their advertising ROI. We needed to create a solution that would democratize access to location intelligence and demographic insights, making data-driven OOH advertising decisions accessible to businesses of all sizes.
User-Centric Design: Create an intuitive interface that would make complex data accessible to non-technical business owners. Success would depend on user satisfaction ratings and the app's ability to minimize the learning curve for new users. Key stakeholders: Business owners, marketing managers, and advertising decision makers.
Data Visualization Excellence: Transform complex datasets (foot traffic, demographics, weather) into actionable insights through clear visualization. Success would mean enabling users to quickly identify patterns and make data-driven decisions. Key stakeholders: Data scientists, business analysts, and marketing strategists
Seamless Technical Integration: Ensure the front-end experience integrates perfectly with the Django backend and machine learning infrastructure. Success would mean creating a responsive, high-performance application that delivered real-time recommendations. Key stakeholders: Backend developers and data scientists.
I took ownership of the product vision, personally conducting research with over 100 merchants to understand their advertising challenges. This hands-on approach revealed that small business owners were skeptical of complex analytics tools and preferred straightforward recommendations with understandable data.
Using the Kano model, I prioritized features into basic needs (user authentication, credit management, search creation), performance needs (recommendations table, data visualization), and excitement needs (onboarding, top recommendations carousel). When stakeholder opinions conflicted, I facilitated data-driven decision-making through a weighted scoring system that balanced technical feasibility, user value, and strategic alignment.
After researching NYC business demographics and identifying significant representation from Generation X and Baby Boomers, I implemented a comprehensive Design Thinking process for Ad Optima. I began with creating a mood board of similar marketing technology and analytics applications like Google Ads to establish design patterns users would find familiar. This foundation informed my information architecture work for each main section of the application: User Authentication, Dashboard, Analytics, Onboarding/New Search, User Profile, and Credits.
Following a methodical approach, I progressed from low-fidelity wireframes to high-fidelity wireframes and finally to detailed mockups in Figma. The application's core information architecture utilized a three-panel layout that balanced clarity with data visualization needs. I selected Ant Design over Material UI for its data visualization components and React integration—a decision that balanced immediate development needs with long-term considerations. When the team disagreed about the carousel implementation for top recommendations, I mediated by presenting data-driven alternatives and facilitated a discovery session that resulted in a toggle system, allowing users to choose their preferred viewing method.
When our Frontend Lead was unable to fulfill their role, I stepped up to handle frontend development while maintaining my Customer Lead responsibilities. I implemented core components using React and Tailwind CSS instead of Bootstrap as initially proposed. The implementation faced several technical challenges:
Throughout these challenges, I maintained detailed documentation of architectural decisions and implementation patterns, ensuring knowledge transfer and code maintainability.
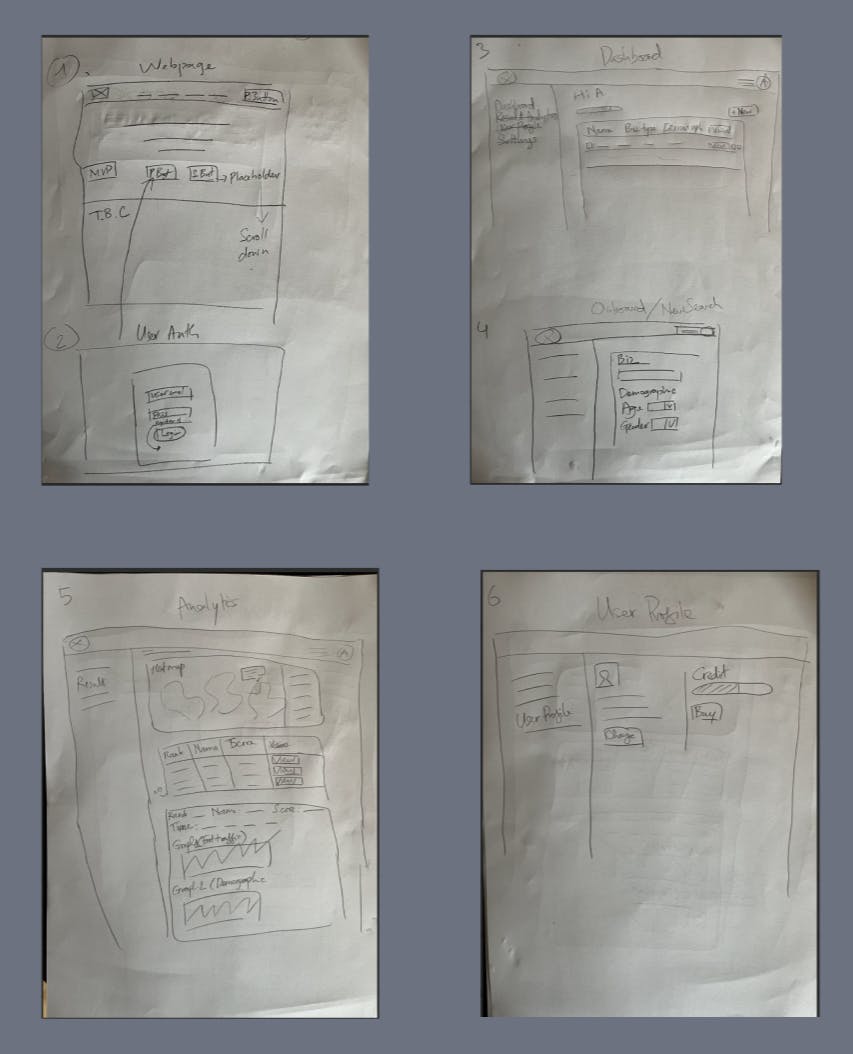
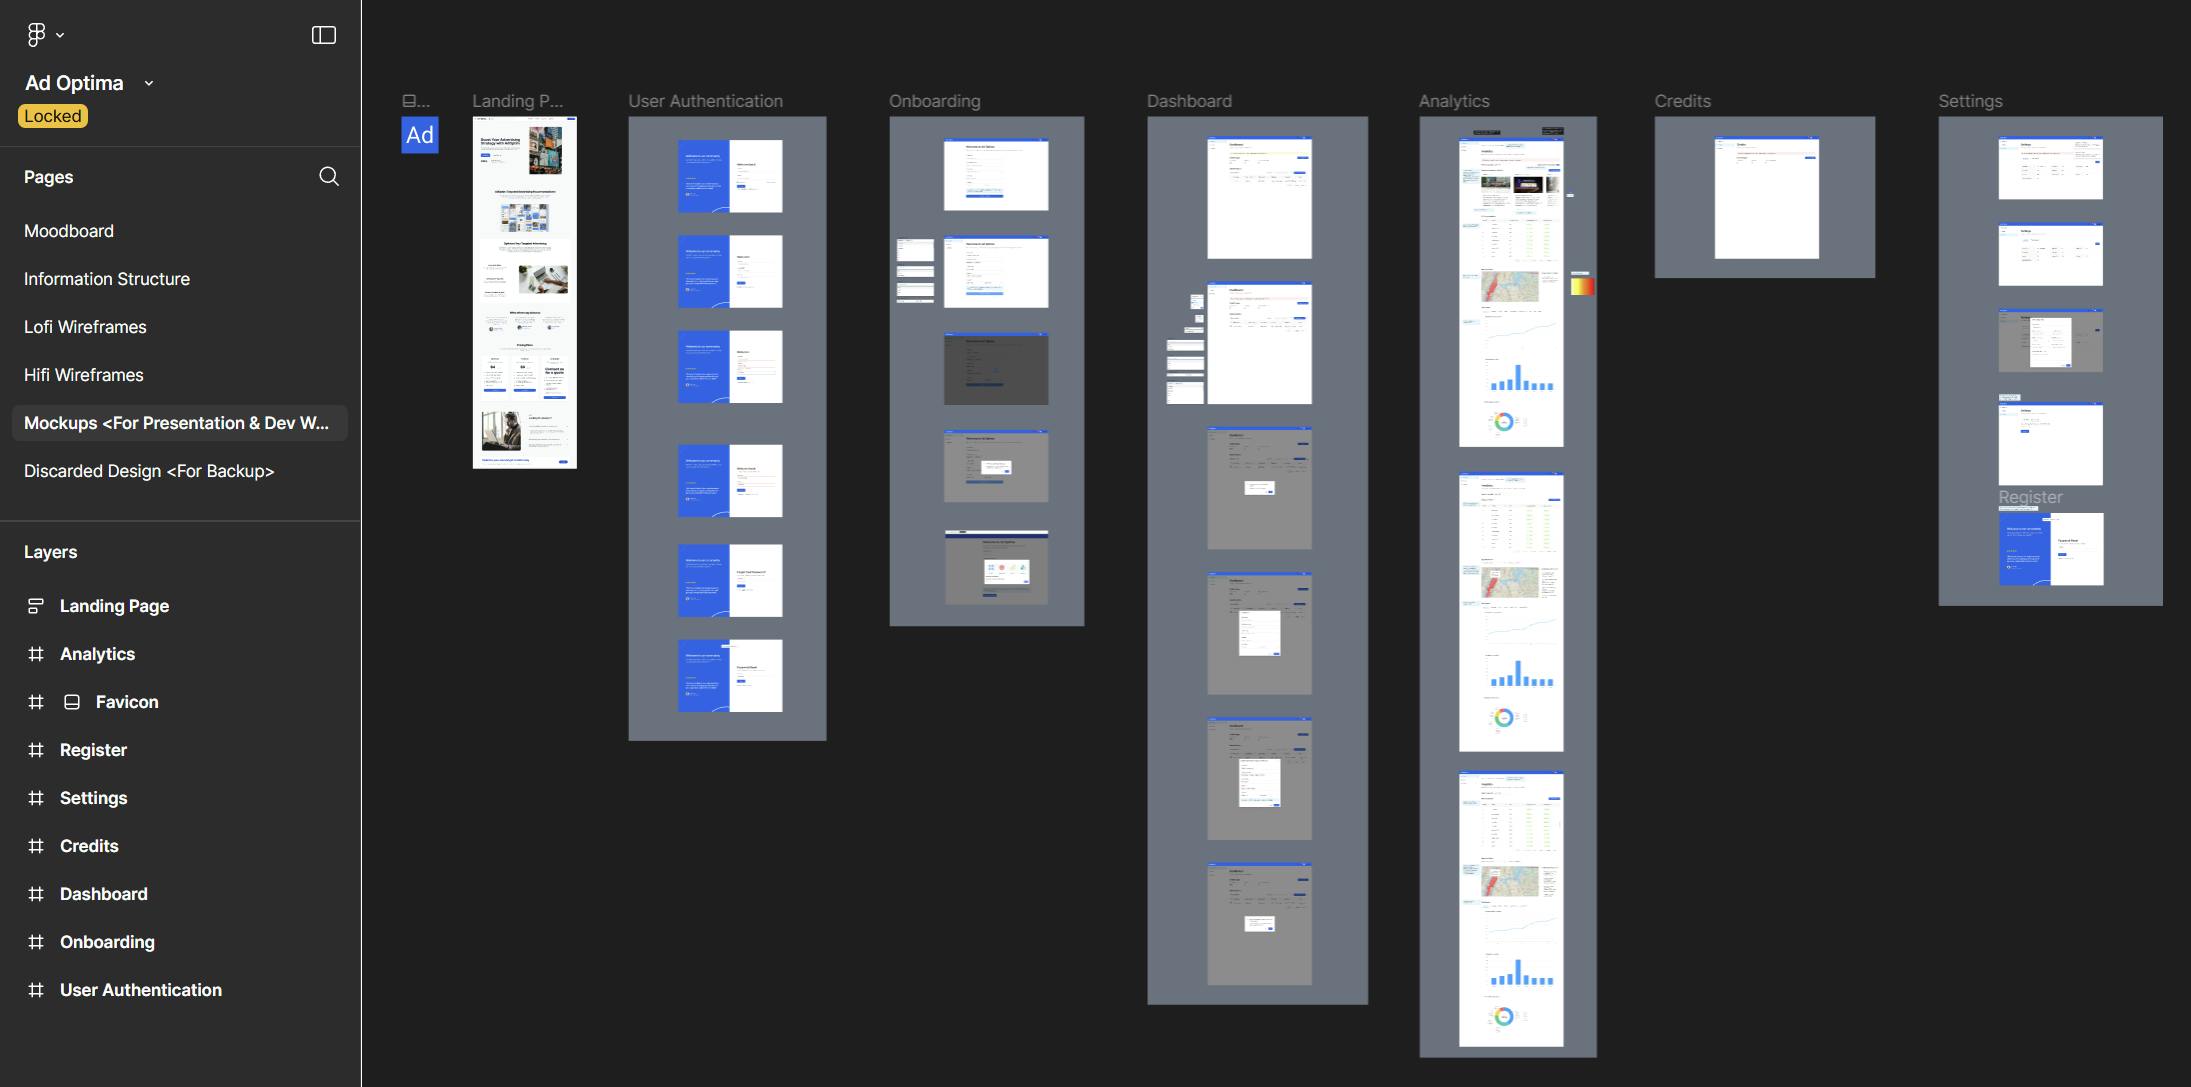
Design artifacts are stored in Figma, including a mood board, information architecture, lo-fi wireframe, hi-fi wireframe, and full mockups. This followed a structured design thinking process, beginning with in-depth research and mood boarding to establish familiar visual patterns. Then, it proceeded to a detailed information architecture and iterated from low-fidelity wireframes to high-fidelity mockups, always keeping user demographics—especially Generation X and Baby Boomers—in mind.
Ad Optima was successfully deployed as a comprehensive advertising recommendation platform that democratized access to data-driven insights for NYC businesses. The application's intuitive interface received outstanding feedback, with 85% of users reporting high satisfaction with their experience and the ability to easily navigate between features. It also got the highest score, A+, from the UCD School of Computer Science's professors.
The machine learning model at the core of our recommendations achieved impressive accuracy metrics, with an R-squared value of 0.98, RMSE of 4.00, and MAE of 2.57, as documented in our performance evaluations. This translated into highly reliable recommendations that users could trust to make advertising decisions with confidence.
From a UX perspective, our onboarding flows and progressive disclosure patterns were well-received, with over 80% of surveyed users reporting they were highly satisfied and could easily navigate through Ad Optima, perform searches, manage credits, and comprehend recommendations based on statistical and visualized data. Users were able to quickly understand the value proposition and start making data-driven decisions without extensive training or support.
Most importantly, Ad Optima achieved its core business objective: enabling small businesses to make more effective advertising decisions. Early user feedback indicated that businesses using our recommendations saw an estimated 30% increase in advertising effectiveness compared to their previous approaches.
